
Chart properties
Chart widgets have some specific properties. These properties can be configured in the Chart Style tab.
Please note that for each chart type only the properties that are relevant for it are offered.

Chart type
Defines the type of the chart.
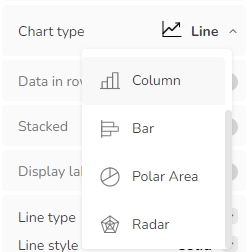
Current options for the chart type are:
Line
Vertical line
Area
Vertical area
Column
Waterfall
Vertical waterfall
Bar
Polar area
Radar
Pie
Data in rows
See Chart content
Dataset names in first row / column
See Chart content
Stacked
Specifies if the included datasets should be stacked in the chart.
Center datasets
Specifies if the chart segments should be centered. This allows e.g. to position a line chart above a column chart.
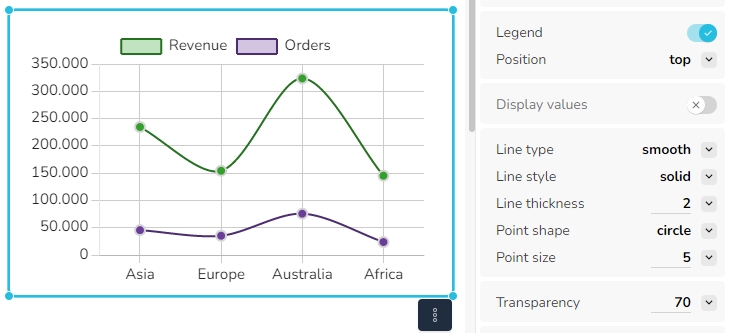
Legend
Specifies if a legend should be displayed for the chart. If switched on, the sub-property Position specifies if the legend should be display on the top, on the bottom, to the left or the right of the chart.
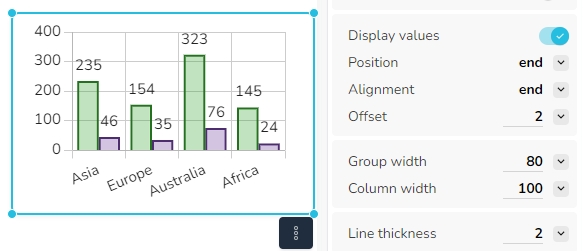
Display values
Specifies if labels should be displayed for the elements of the chart. This property has the following sub-properties:
Position - specifies if the value should be displayed around the start, the center or the end of the chart segment.
Alignment - specifies how the value is to be displayed in the environment of position. Possible values are start, center, end, left, right, top, bottom.
Offset - specifies the distance from the value from the point defined by position. Please note that negative values are allowed as well.
Line type
Specifies if lines should be drawn smooth or straight between chart elements.
Line style
Specifies if lines should be drawn solid, dashed or dotted between chart elements.
Line thickness
Specifies the thickness of the lines between chart elements.
Point shape
Specifies if chart elements are displayed as circle, disc or square.
Point size
Specifies the size of the chart element in pixel.
Transparency
Specifies the transparency of the background of chart segments. 0 means no transparency, 100 means full transparency.
Zero line
Specifies if a line should be displayed at the position of the 0-axis. If switched on, the color and size of the line can be specified.
Horizontal axis
Specifies if the labels for the horizontal axis should be displayed.
Rotate labels
Specifies if the chart labels of the horizontal axis are to be rotated. Setting auto means automatic rotation, depending on the length of the labels. In the popup menu, the value of the clock-wise rotation in degrees can be selected.
Vertical axis
Specifies if the labels for the vertical axes should be displayed.
Min value
Specifies the minimum value of the chart.
Max value
Specifies the maximum value of the chart.
Auto-adjust
Specifies if the defined Min value and Max value should be applied exactly, or in a way that the entire chart content fits comfortably in the chart area, including evenly distributed grid lines between the min and max value.