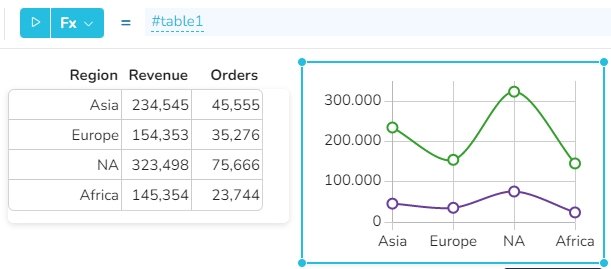
The content of a chart widget must be provided in a specific format. By default, the first column of the data contains the x-axis lables, and the other columns contain the single datasets of the values.
In this example, the chart retrieves its content directly from a table widget. But the content can as well be defined with any formula returning a range of data.
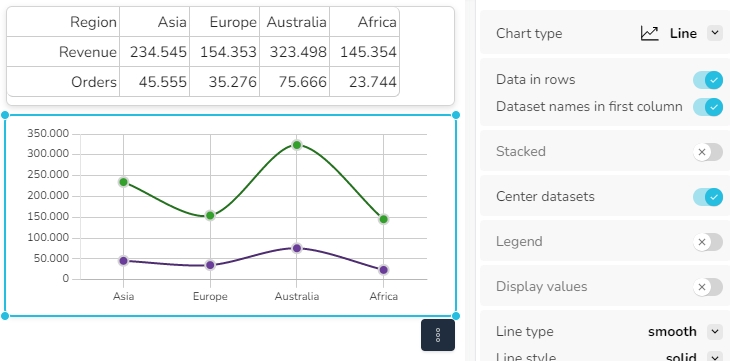
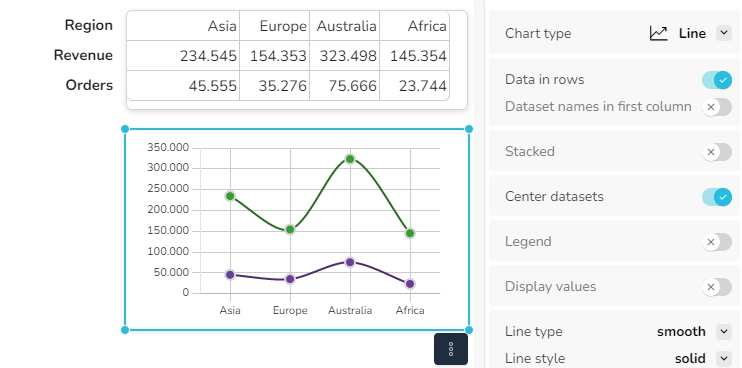
In many cases, datasets are available in a horizontal orientation. Here the option Data in rows can be used to define that the underlying data is oriented in rows instead of columns.
If the first row contains the names of the dataset, the option "Dataset names in first row" must be switched on. Then the dataset name is displayed in the tooltip.
If the first column contains the names of the dataset, the option "Dataset names in first column" must be switched on.


